You are here
Firelog
Description:
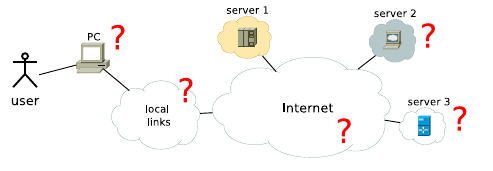
Firelog is a hybrid probe capable of performing passive and active measurements in the web browsing domain in order to identify a poor quality of experience (i.e., a high page load time) and to diagnose its root causes.
The official Firelog page is available at http://firelog.eurecom.fr/mplane.
Firelog consists of different modules: (1) an instrumented headless browser, (2) a network packet analyzer and (3) an active measurements monitor.
Such components independently capture events and metrics and store them in a local data store. An additional orchestration process accepts as input one or more ``seed URLs'' to inspect, uses the above modules to collect data, and finally proceed with their mapping to a unique identifier space, to build a database of correlated events and metrics that can be used as a training set for an application-specific data analysis.
Firelog is based on the PhantomJs headless browser for two reasons: (1) our interest is not Web usability but rather page downloading speed, and (2) for not imposing an overhead in the browser's activity.
We instrumented the browser for injecting in each HTTP GET message a random identifier for each object in the requested Web page, which is used to establish a link between measurements taken at different layers of the stack.
Similarly, the packet analyzer collects the transport-level measurements and associates each requested Web object with the corresponding TCP flow, by exploiting the injected identifier.
Finally, the active measurements monitor takes care of performing network-level measurements against selected destinations, corresponding to servers involved in building up the Web page under examination.
All the data are processed to diagnose the current web browsing session, providing details on the root cause for a (possible) high page load time.
Metrics and capabilities
Metrics
The workflow of the probe is composed by three distinct phases, as follows.
Phase 1. In the first phase, the probe browses a given URL. Each fetched object is associated with a unique identifier, exploited by the packet analyzer to associate the corresponding TCP flow to the object. All the browser level measurements and the passive measurements are taken in this phase.
Core metrics for Phase 1 are:
- session start: timestamp of the starting of the current web browsing session
- full load time: the page load time for the current session
- For all objects in a web page:
- http time: time elapsed between a HTTP GET for an object and the $1^{st}$ byte of data received for that object
- tcp time: TCP handshake timing to the server providing the object
- netw bytes: size of the object
- rcv time: time elapsed for receiving the complete object
Phase 2. In the second phase, the active measurements take place. All the collected IP addresses are processed, sending ICMP messages towards all the destinations and performing a Traceroute against the primary IP address (i.e., the IP resolved by the DNS). By doing this, we collect path information for all the resources contained in the browsed Web page.
Core metrics for Phase 2 are:
- For the primary IP address:
- ping: RTT to destination
- traceroute: complete path towards the destination
- For all the collected IP addresses (e.g., secondary servers for particular resources):
- ping: RTT to destination
Phase 3. All the data relative to the same Web browsing session are packed together and stored in a CSV file and sent to the DISC repository for further analysis. A preliminary analysis of the data collected so far is returned on termination.
Core metrics (among all the others, derived from previous phases) for Phase 3 are:
- page size: sum of the sizes of all the objects
- number of secodary servers
Capabilities
Firelog offer the capability to run a local diagnosis algorithm towards a specific web site.
- firelog-diagnose: enables the diagnosis of a browsing session towards a given web site.
capability: measure
label : firelog-diagnose
link : /
token : 4e9b281073bd9334ca8f45704a90a1bc
when : now + 5m
parameters ( 1):
link : /
token : 4e9b281073bd9334ca8f45704a90a1bc
when : now + 5m
parameters ( 1):
destination.url: *
metadata ( 3):
System_type: firelog
System_version: 0.1
System_ID: firelog-Proxy
System_version: 0.1
System_ID: firelog-Proxy
results ( 1):
firelog.diagnose
Probe execution environment
Firelog is written in Python3, and it is coupled with a Javascript script for exploiting the headless browser toolkint and two C scripts for managing the embedded Tstat version.
It has been compiled and tested under Unix/Linux environments, specifically under:
- Ubuntu 14.10 64bit
- LinuxMint 16 Petra 64bit.
The Python3 environment is needed also to run the proxy derived from the reference implementation RI/SDK.
Installation of standalone probe
We recommend the user to refer to the lastest version available on GitHub:
git clone https://github.com/marcomilanesio/qoe-headless-probe.git
Usage of standalone probe
Requirements: All the additional software can be retrieved from http://firelog.eurecom.fr/mplane/software:
- phantomJS headless browser toolkit
- apache flume > 1.5.2
- custom Tstat 2.4
First, configure and compile Tstat on your machine, following the instruction at http://tstat.tlc.polito.it/index.shtml
$ cd eur-tstat-2.4
$ ./autogen.sh
$ ./configure.sh
$ make
$ cd ..
DO NOT run "make install".
You need to compile with sudo privileges the C programs in the script/ folder:
$ cd script
$ sudo gcc -o start.out start.c
$ sudo gcc -o stop.out stop.c
$ sudo chmod 4755 *.out
You need a set up a configuration file for Tstat, specifying the interface to sniff (see http://tstat.tlc.polito.it/index.shtml for details).
Then, you have to modify accordingly the parameters in the file conf/firelog.conf.
Once all the steps are done, you run it by typing:
$ ./phantomprobe.py -h
Integration into an mPlane environment
Firelog is able to communicate with other mPlane components, thanks to the interface that makes it mPlane compliant. Please refer to the following GitHub repository for the latest version of the interface:
git clone https://github.com/fp7mplane/components.git COMPONENTS_DIR
Once Firelog is properly installed, get the latest version of the mPlane protocol RI at the following GitHub repository:
git clone https://github.com/fp7mplane/protocol-ri PROTOCOL_RI_DIR
and add the Firelog components to protocol RI.
The following instructions assume you are in the [COMPONENTS_DIR] folder.
$ cd firelog
$ ./install.sh [--flume]
The install.sh will take care of downloading and installing the additional software needed, and also to configure Tstat.
The option --flume if set, will take care of installing also a flume agent for the Firelog probe, to be used with a HDFS DISC repository.
- Check the parameters in the file conf/firelog.conf (e.g., directory of the installed Tstat and PhantomJS, username and so on)
- Check the parameters in the file conf/firelog-tstat.conf (e.g., source IP address/mask to sniff from)
- Set the parameters in the file conf/firelog-flume.conf (e.g., flume sink address)
Finally, set the environment variable MPLANE_RI to point to [PROTOCOL_RI_DIR]:
$ export MPLANE_RI=[PROTOCOL_RI_DIR]
New features supported by the mPlane project
Firelog has been completely developed within the mPlane project, and it's still under constant development by Eurecom.
Changes since D2.2
- full support to export to HDFS (csv or json)
- bug fixing: The platform is constantly maintained and bug fixes are pushed to the public git repository;
- mPlane proxy. Python based proxy for the mPlane RI SDK to enable its usage in mPlane Reference Implementation's distributed measurement
Links to sources, binaries
- official mPlane website: https://www.ict-mplane.eu/public/firelog
- standalone version: https://github.com/marcomilanesio/qoe-headless-probe.git
- interface to mPlane components: https://github.com/fp7mplane/components.git
- The official Firelog web page: http://firelog.eurecom.fr/mplane.
Official version(s)
- May 15th, 2014: frozen release for D2.2
- July 10, 2015: for D2.3
- standalone version: https://github.com/marcomilanesio/qoe-headless-probe.git
- interface to mPlane components: https://github.com/fp7mplane/components.git
File:
|
The information available on this website is property of the contributing authors from the mPlane Consortium (project FP7-ICT-318627) and does not necessarily reflect the view of the European Commission. The information in this website is provided "as is", and no guarantee or warranty is given that the information is fit for any particular purpose. The user uses the information at its sole risk and liability. |